Value Investing / Main Index / previous / next

July, 2018

BEATING THE ODDS
by LARRY

Most investors do not match market returns on common stocks. Per Credit Donkey, the average annual return of a U.S. investor for the past 30 years has been just 3.66%. So even besting that meager level is a step forward. Since our essay for the May, 2018, issue, "An Alternative View," I have tried by various means to come up with an approach to investing superior to the one given there, represented in the suggested funds. After all, that method, holding equal allocations in five assets (the symbols for which are: VFIAX; VFSVX; VFIDX; VGSLX; and VSIAX), though certainly an improvement on returns of 3 to 4% annually, has only provided gains and dividends totaling about 10% a year, give or take around half a percent.


So, using the analyzer site, Portfolio Visualizer, I have tested a variety of options that might have superior outcomes. And there are, in fact, successful combinations of mutual funds and common stocks that for those with patience can get the job done. Results show that one could have done significantly better than 10% annual total returns with certain methods. The catch, though, is that a number of these techniques, even the 20% each in five assets method suggested in the AAII article, offer less impressive risk-adjusted returns.


In general, the asset classes suggested in "An Alternative View" and the AAII Journal article from which that portfolio was derived ("Coming Out Ahead by Doing Less," by Charles Rotblut, CFA, AAII Editor, in AAII.com; May 3, 2018) have inceptions too recent for relevant backtesting through the most turbulent period for investors in recent history, 2008-2009. However, a rough facsimile of this sort of portfolio can be created from types of investments which have been around since prior to the Great Recession. Using these categories and the Portfolio Visualizer site, I came up with figures for what likely would have occurred if the Charles Rotblut AAII portfolio had been in use for the period since January, 1995. This 23-plus year timeframe, of course, covers the biggest bull markets and worst bear markets in the experience of most investors alive today.


The upshot? An equal allocation in the five categories represented by the AAII suggested portfolio (the S&P 500 Index, international small-cap companies excluding U.S., intermediate-term U.S. investment grade bonds, U.S. REITs (real estate investment trusts), and U.S. small-cap value) in backtests showed average annual gains of 9.68% from early 1995, with a worst year performance of negative 26.90%. By comparison, the S&P 500 Index for the same period was up on average 9.85% annually but had a worst year showing of negative 37.02%.

For me, then, the challenge was to come up with approaches that would have done significantly better than those, while not having lost almost 27% in 2008.

Here are a couple possibilities:


Mutual Funds

As in the graphic, a nearly two-thirds investment in Vanguard's original health care fund, VGHCX, plus about one-third in Vanguard's long-term treasury bond fund, VUSTX, if rebalanced annually, with all distributions reinvested and no redemptions, would, per Portfolio Visualizer, have taken a $10,000 investment at the beginning of January, 1995, to almost $165,000 today and with a worst year performance of just negative 5.53%. For the same period, an equal investment in the S&P 500 Index, as represented by Vanguard's original S&P 500 fund, VFINX, would also have gone up nicely, but today would be worth less than $91,000 and would have had a worst year performance of negative 37.02%.
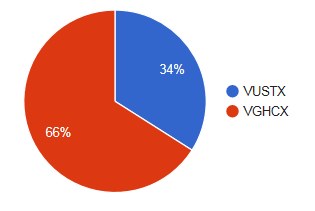

A 34% allocation in Vanguard Long-Term Treasury, Investor Shares, plus a 66% allocation in Vanguard Health Care, Investor Shares.

I am not necessarily recommending this combination for the future. A health care fund is rather specialized and might or might not continue to perform as well long-term as this one did over the past couple decades or so. The point, though, is that winning sets of mutual funds can be found that can in fact do better in absolute and risk-adjusted terms than the major market indexes.


Stocks

With individual securities, the prospects for reliable backtesting are more tenuous. Corporations are merged, go bankrupt, spin-off shares into other companies, go private, etc. Moreover, there is an almost infinite variety of portfolios that might be checked over diverse timeframes. With this in mind, I propose simply a conservative discounting of the figures available for certain Charles Schwab stocks, those receiving the brokerage's highest (A) rating. (Other brokerages also have highly ranked stocks that are regularly suggested for purchase, and these might do as well or better than Schwab's record. Am using Schwab's only because familiar with its record and know it has been researched and found to be on the whole valid.)


Since inception, May 6, 2002, the Schwab A-rated stocks have, for all 52-week periods available, averaged total returns of 18.43%. I suggest this figure be discounted by a third to allow for the possible difference in performance if the results could be projected back to early January, 1995. This would give us a cautious estimate of 12.29% for the top rated stocks under Schwab's system. Even given the approximate nature of this comparison, it would be better than that for the S&P 500 record since the beginning of that year. And if we wished to be still more conservative, a 20% allocation in 10-year treasuries, rebalanced annually to assure a hypothetical 80% allocation in Schwab's A-rated stocks, would have lowered worst year performance through the period since, yet the combination still would have had good chances for beating the S&P 500 Index average return since January, 1995, of 9.85% a year, by a full percentage point.

Yet there are currently 282 A-rated U.S. traded Schwab stocks. How to choose among them? Past returns have been better than average if one were to simply throw darts to randomly select common stocks in which to invest. So, one could pick a portfolio of, say, forty A-rated Schwab stocks or else use the company's shorter, composite A-rated list, for variety across industries and market-caps. An investor could add one equity a week till having the desired number, then hold each for a year and a day or till no longer having the highest Schwab rank, whichever is longer, replacing sold securities with new A-rated stocks.


Here are five from the most recent Schwab composite list of A-rated assets:

Amkor Technology AMKR $8.88

Conoco Phillips COP $71.00

Northrim BanCorp, Inc. NRIM $41.75

Resources Connection, Inc. RECN $17.60

Zumiez, Inc. ZUMZ $24.05


If interested in a method similar to this, one can get assistance from one's financial consultant or discount brokerage. After the favored parameters are in place, subsequent investments can be made in a fairly mechanical way.

Best of luck with your own efforts toward lower risk, higher return investments and so with beating the odds.


DISCLAIMER

Larry is not a professional. Don't take him seriously!

Actually, the investment article provided here is for general information only and should not be considered as professional advice, a solicitation to buy or sell any security, or the Word of God. Investors are encouraged to do their own research while considering their personal goals and circumstances, or consult their own professional financial advisors, before making investment decisions. Neither Larry nor LARVALBUG will be liable for any losses sustained by any visitor to this site.

(Disclosure statement: Larry and Val have holdings in some of the suggested assets but do not "make a market" in any of them and do not derive any direct benefit from recommending them, except perhaps for a bit of smug self-satisfaction.)


Value Investing / Main Index / previous / next